Want more housing market stories from Lance Lambert’s ResiClub in your inbox? Subscribe to the ResiClub newsletter.
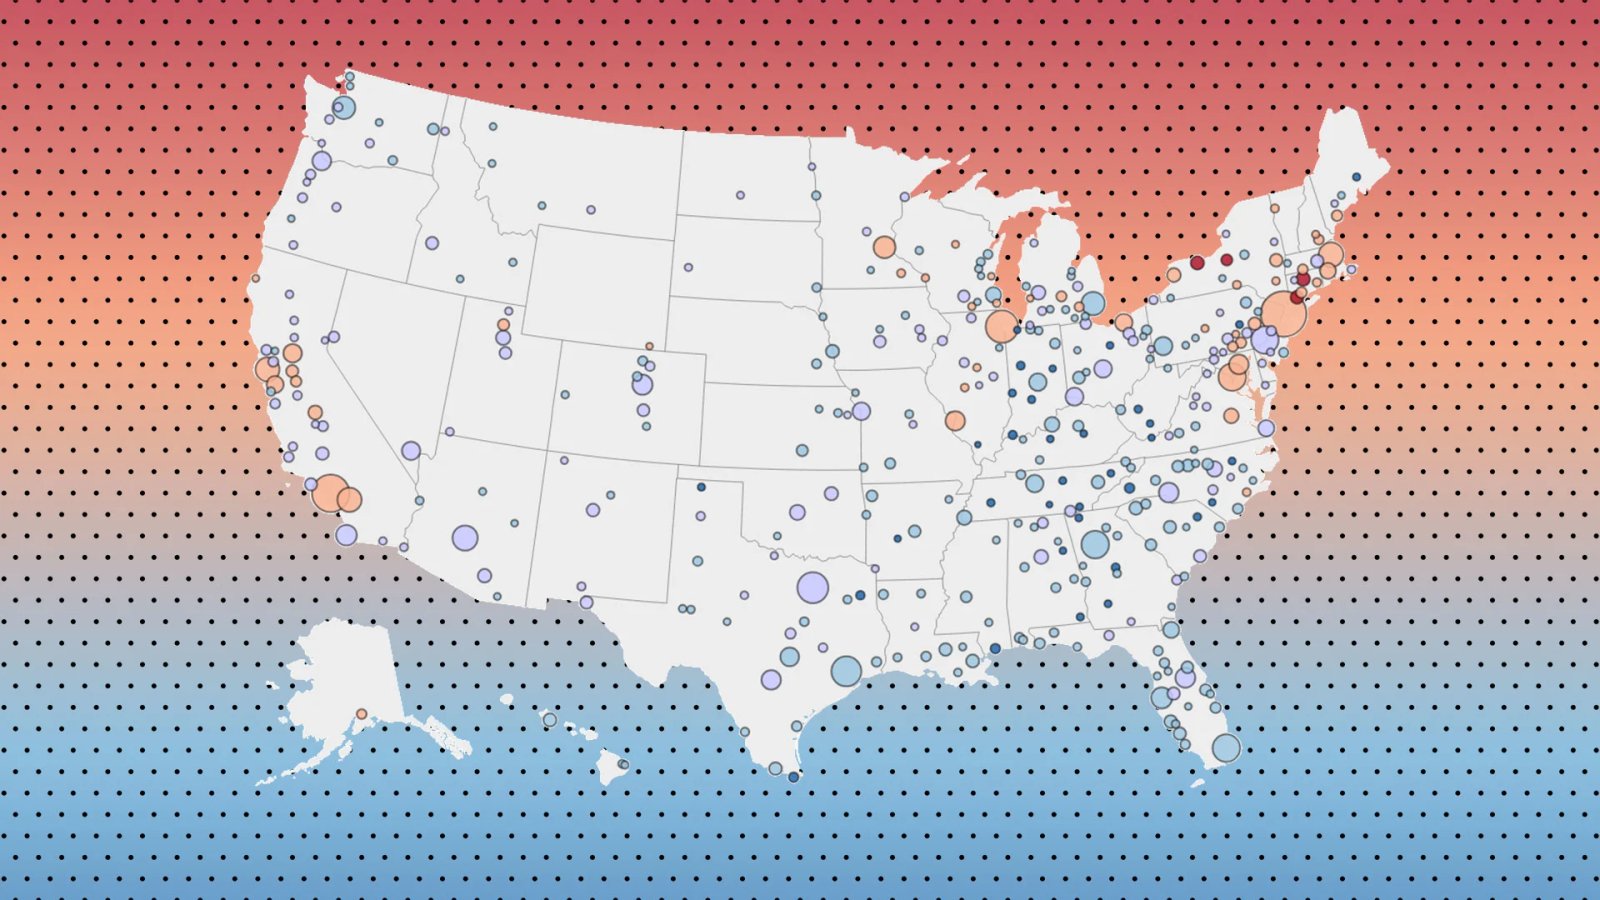
Zillow economists use an economic model known as the Zillow Market Heat Index to gauge the competitiveness of housing markets across the country.
This model looks at key indicators—including home price changes, inventory levels, and days on market—to generate a score showing whether a market favors sellers or buyers.
Higher scores point to hotter, seller-friendly metro housing markets. Lower scores signal cooler markets where buyers hold more negotiating power.
According to Zillow:
- Score of 70 or above = strong sellers market
- Score from 55 to 69 = sellers market
- Score from 45 to 54 = neutral market
- Score from 28 to 44 = buyers market
- Score of 27 or below = strong buyers market
Nationally, Zillow rates the U.S. housing market at 48 in its October 2025 reading, published last week.
That said, Zillow’s reading varies significantly across the country.
Among the 250 largest metro-area housing markets, these 20 are the HOTTEST markets—where sellers have the most power:
- Rochester, NY → 120
- Syracuse, NY → 80
- Hartford, CT → 76
- Bridgeport, CT → 70
- Racine, WI → 67
- San Francisco, CA → 66
- New York, NY → 65
- Albany, NY → 65
- Lancaster, PA → 65
- Manchester, NH → 64
- San Jose, CA → 63
- Poughkeepsie, NY → 63
- Anchorage, AK → 63
- Springfield, MA → 62
- Norwich, CT → 62
- Providence, RI → 60
- Kingston, NY → 60
- Richmond, VA → 59
- Buffalo, NY → 59
- New Haven, CT → 59
Among the 250 largest metro-area housing markets, these 20 are the COLDEST markets—where buyers have the most power:
- Florence, SC → 8
- Jackson, TN → 10
- Gulfport, MS → 14
- Lafayette, IN → 18
- Longview, TX → 19
- Charleston, WV → 20
- Macon, GA → 20
- Terre Haute, IN → 22
- Brownsville, TX → 25
- Evansville, IN → 25
- Asheville, NC →26
- Fayetteville, AR → 27
- Daphne, AL → 28
- Beaumont, TX → 29
- Hickory, NC → 29
- Lubbock, TX → 30
- Naples, FL → 31
- Saginaw, MI → 32
- Bowling Green, KY → 32
- Lincoln, NE → 33
Does ResiClub agree with Zillow’s assessment?
Directionally, I believe Zillow has correctly identified some regional housing markets where buyers have gained the most power—particularly around the Gulf—as well as markets where sellers have maintained (relatively speaking) somewhat of a grip, including portions of the Northeast and Midwest.
Based on my personal housing analysis, I consider much of Florida (particularly southwest Florida) and chunks of Texas (particularly areas with a lot of new single-family home construction) the weakest/softest chunk of the U.S. housing market. Not too far behind are pockets of Colorado, Georgia, and Arizona markets where there’s built-up unsold spec inventory.
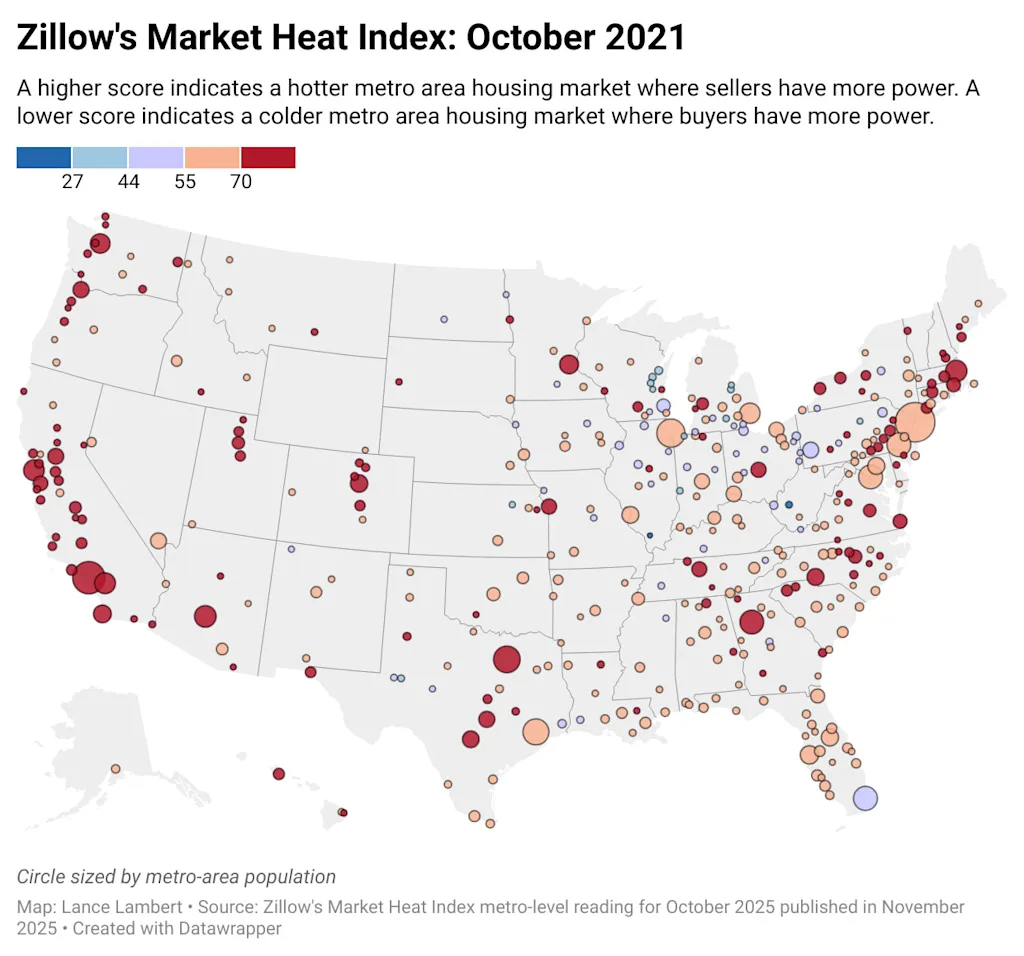
What did this Zillow analysis look like back in spring 2021 during the pandemic housing boom? Below is Zillow’s October 2021 reading, published in November 2021:
The final deadline for Fast Company’s World Changing Ideas Awards is Friday, December 12, at 11:59 p.m. PT. Apply today.